Published Poobesh Gowtham
Child trafficking in India
In-depth analysis and visualisation
Data analysis · Data visualisation
Building an Interactive Dashboard to be used by Kailash Satyarthi Children’s Foundation and Ministry of Women and Child Development for Data Driven strategy planning and policy making.
This is the work I did as a Data Analyst for Kailash Satyarthi Children’s Foundation ( https://satyarthi.org.in ) in Summer of 2019.
The whole project is under NDA, hence I removed any kinds of titles, keys, legends and scales from the visualisations.
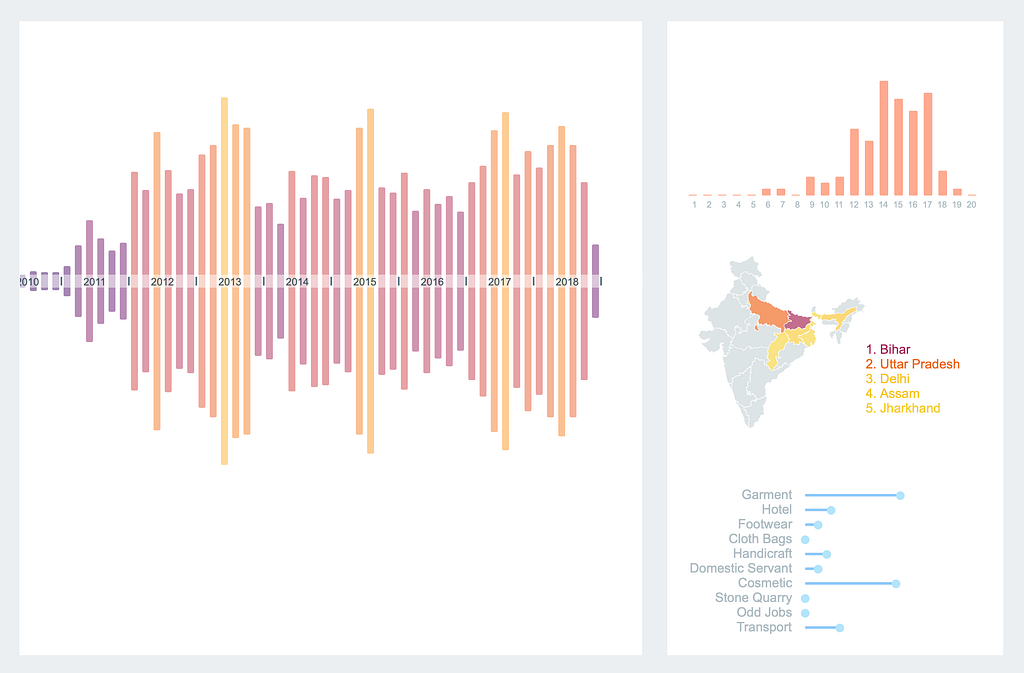
Child trafficking in India is still a prevalent problem. How can Data analysis help solve it ?
Kailash Satyarthi Children’s foundation has been at the forefront of Child rights movement in India. They have successfully conducted a lot of raids, across India with the help of Police department and have rescued thousands of kids over the past decade. During such raids, they were able to aggregate a lot of data regarding the kids, their background, working conditions and more. This resulted in a database of over 20,000 children and 30+ parameters.

Data Cleaning
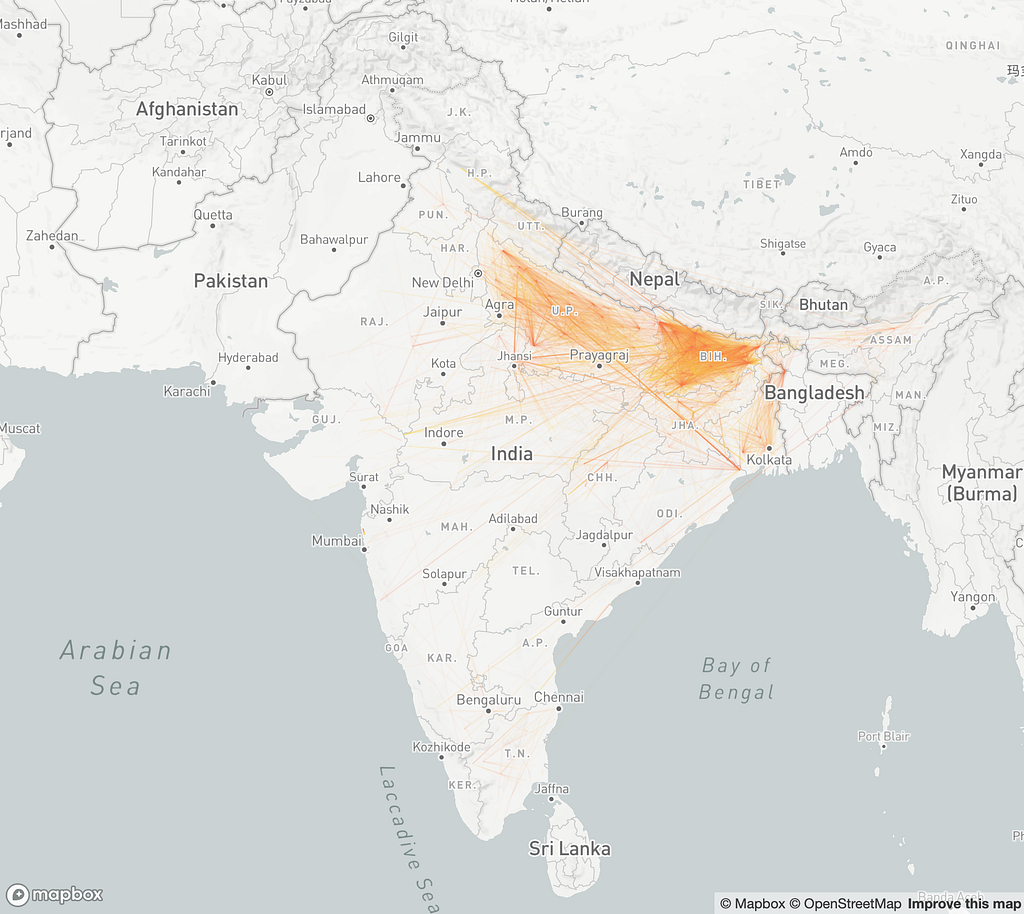
I spent an entire week cleaning and formatting the data. Some columns were discarded and a lot of them were combined. All the places involved were mentioned using local names. It was quite troublesome to convert them into coordinates. I used HERE API to get the coordinates, but there was an issue - there were a lot of discrepancies between place names and coordinates, but no method to identify them. As an evaluation method, I plotted a line between the native village and the police station where the complaint was filed. Ideally, the lines should be small on a map. But that wasn’t the case.
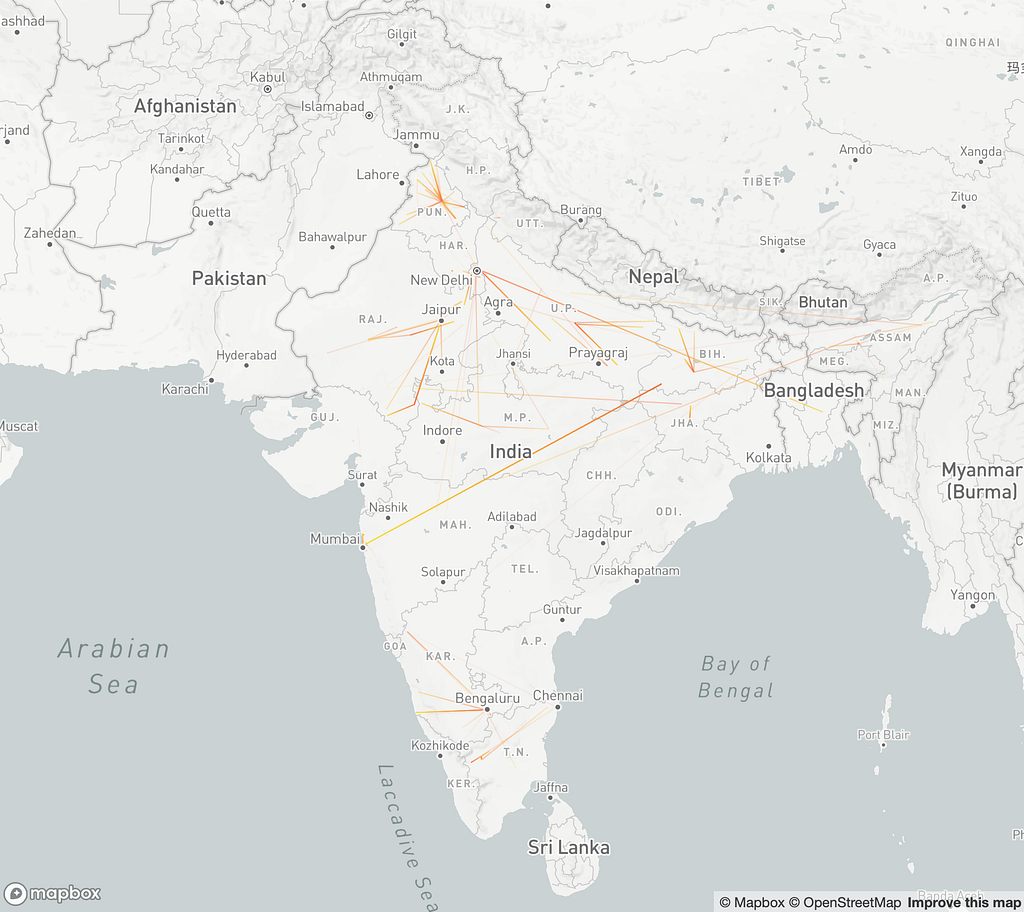
After a lot of rigorous process and more complex API call structures and filter, I was able to bring down the error in coordinates.
With that I was able to compile a list of attributes for each child that contained all the data I required.
id             : unique ID to identify the child if required
age            : age of child when rescued
start_age      : age at which the child started working
r_date         : date of the raid in which the child was rescued
t_date         : approximate date on which the child was trafficked
dur            : duration for which the child was working
raid_v_name    : name of the village where the raid was conducted
raid_v_add     : address of the village where the raid was conducted
raid_v_crd     : coordinates of the village of the raid
native_v_name  : name of the village where the child is from
native_v_add   : address of the village where the child is from
native_v_crd   : coordinates of the village where the child is from
indst          : industry in which the child was working
income         : annual income of the child's parents
wage_week      : wage the child received per week (if any)
wage_type      : periodicity of the wage (if any)
paypar         : if parents paid for the child to be trafficked
paramt         : amount parents received
brought        : who brought the child to work
sisters        : number of sisters the child has
brothers       : number of brothers the child has
school         : schooling status of the child
class          : last class the child studied at
Data Bias
The data provided to me was not complete by any means. Most of the raids were primarily conducted in North India and a few locations in the South. So I had to keep that bias in mind while plotting the data as it was easier to misrepresent the truth due to very selective nature of the dataset. I also have to make the frameworks in such a way that it would be able to incorporate future additions to the database.
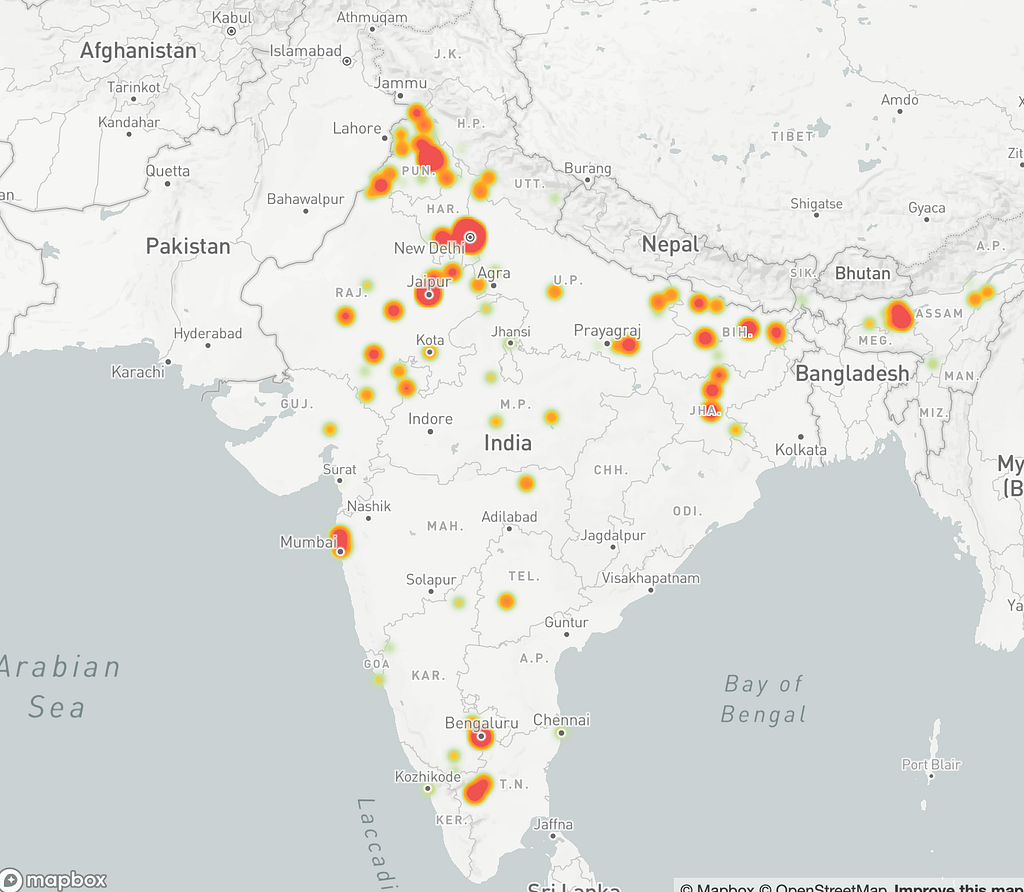
Data Exploration
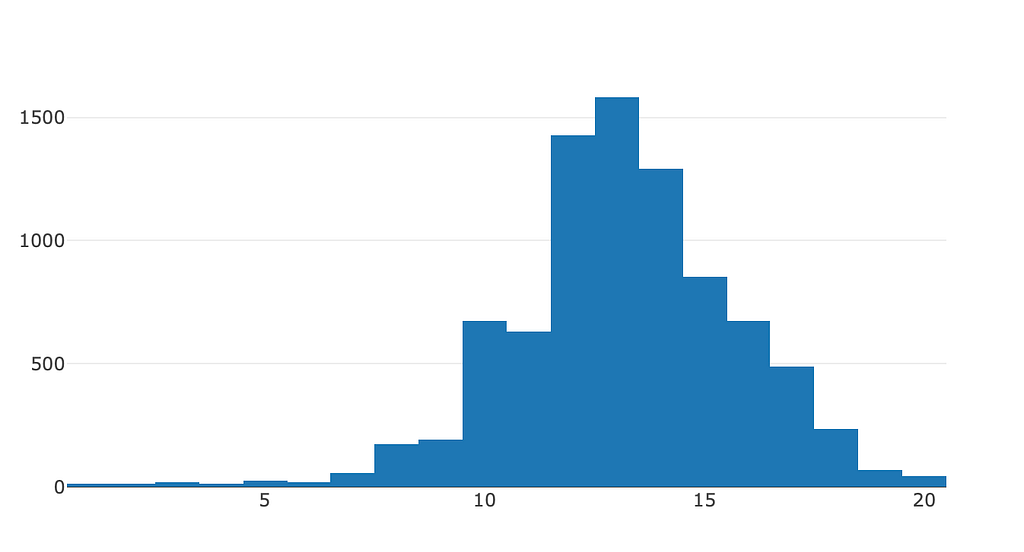
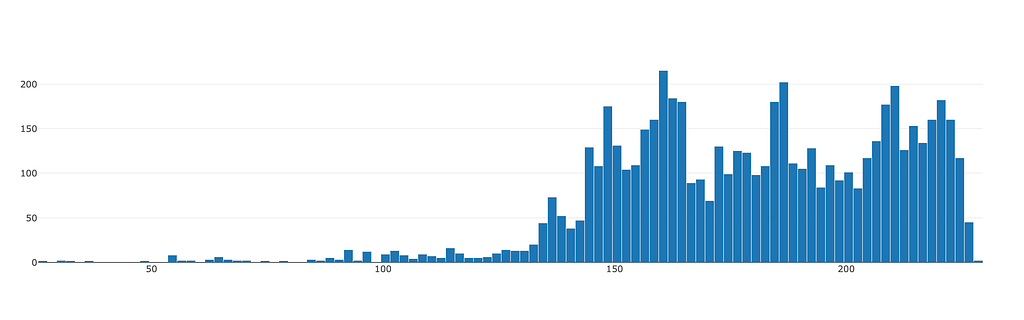
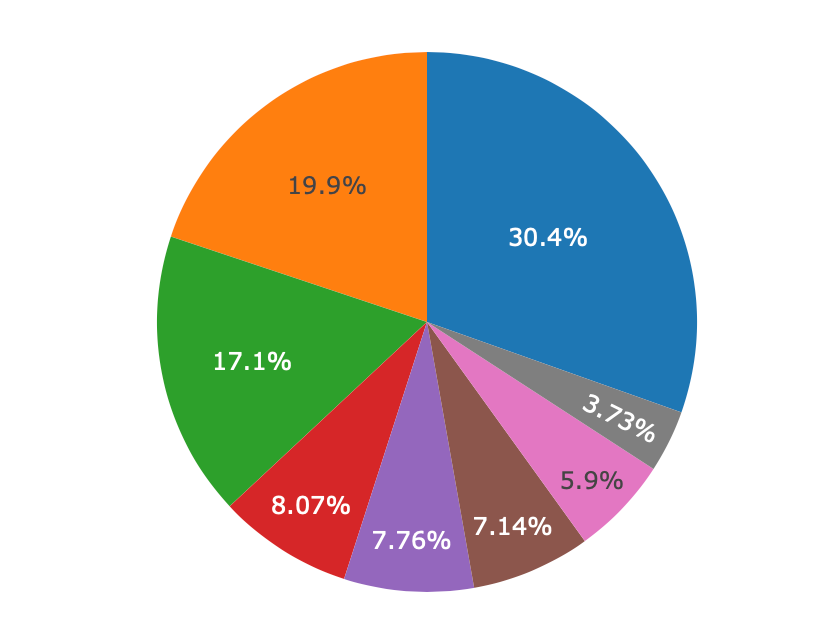
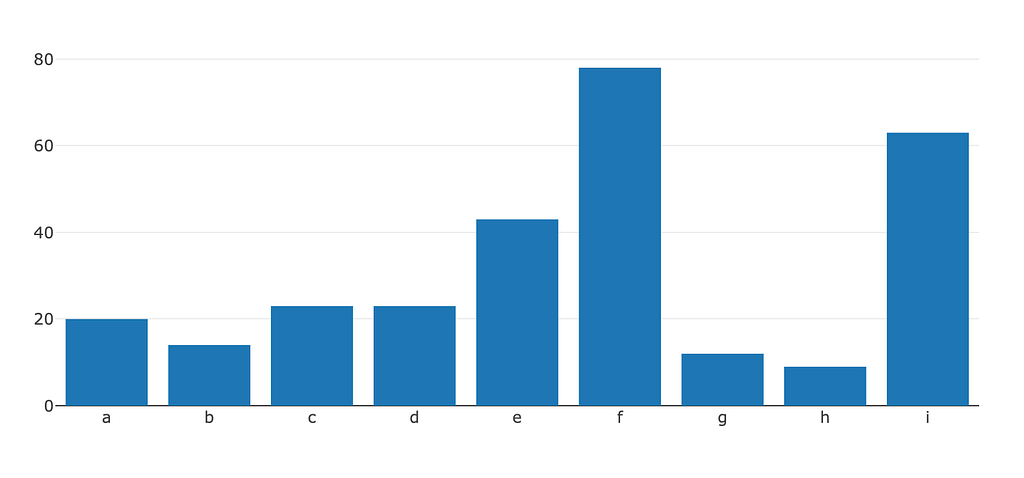
With the data formatted, I began exploring the data to better understand its nature. I used Plotly.js to quickly generate plots of various attributes.
First Iteration
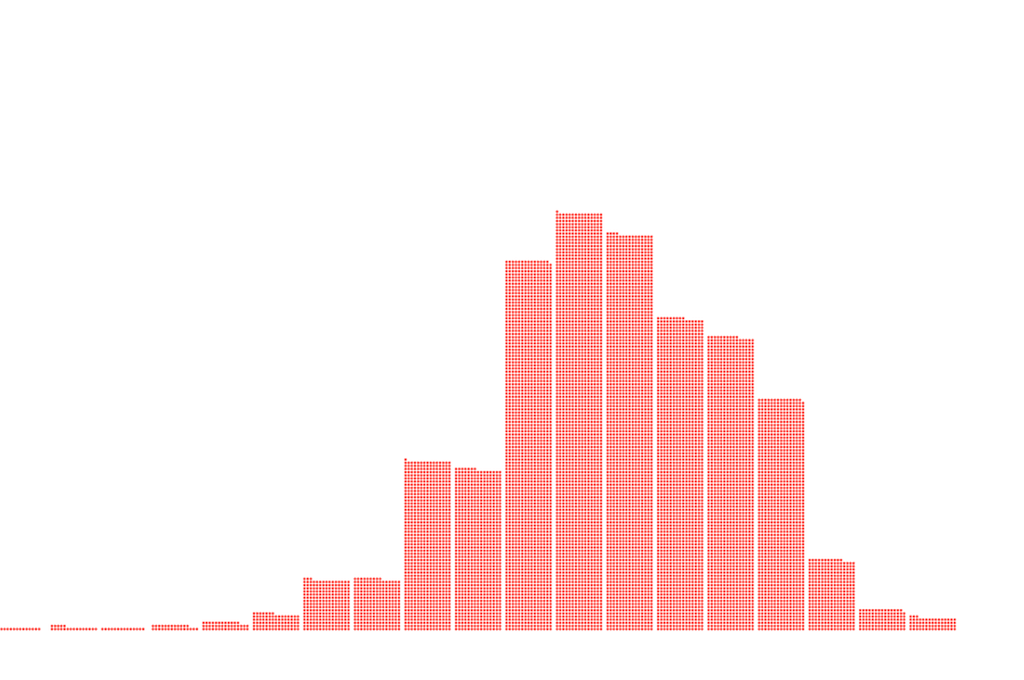
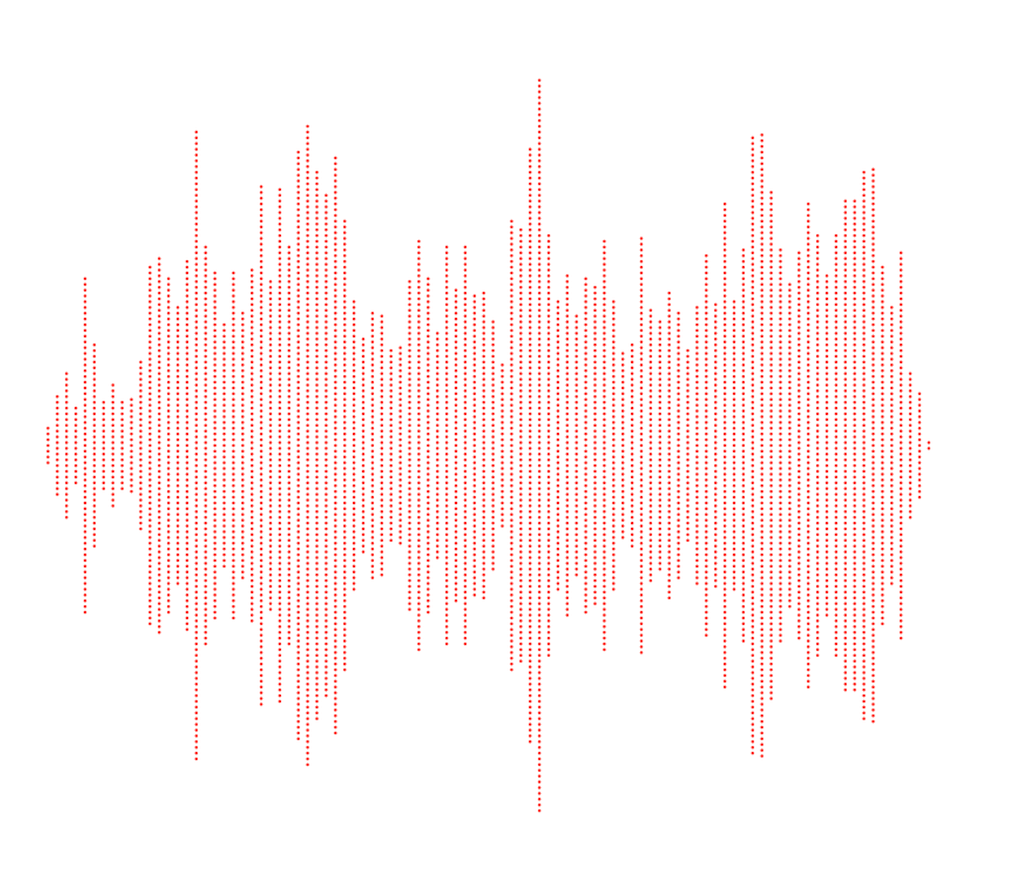
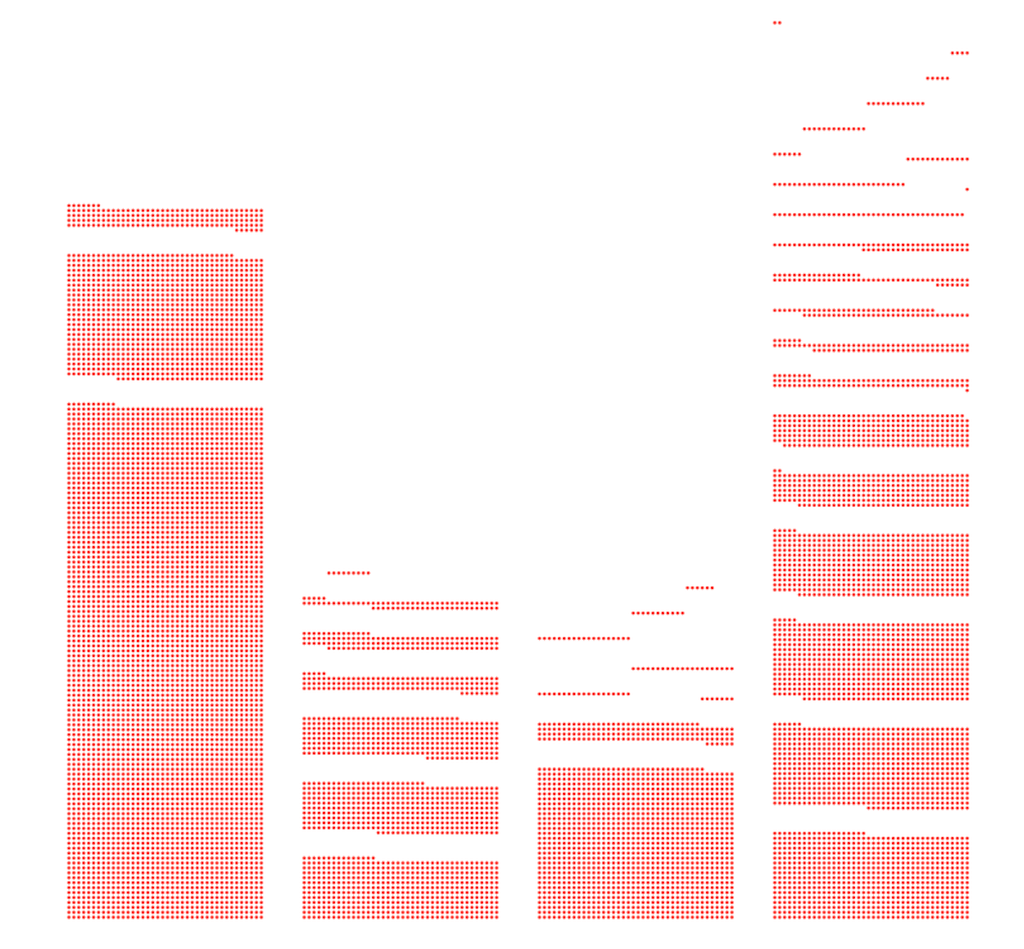
Once I got a hang of the kind of data I’m dealing with, I proceeded with making the first round of visualisations. Back then, the idea was to create an Interactive Data story. So I had it in mind while creating the visualisations. The idea was to have one dot representing one child and the dot move around the screen to create the visualisations.
Second Iteration
I realised that this way of representing data wasn’t representing all the intricacies of the data. After working on this dot matrix style for almost a month, I decided to drop it and adopt a different style that would help me bring out a lot of insights.
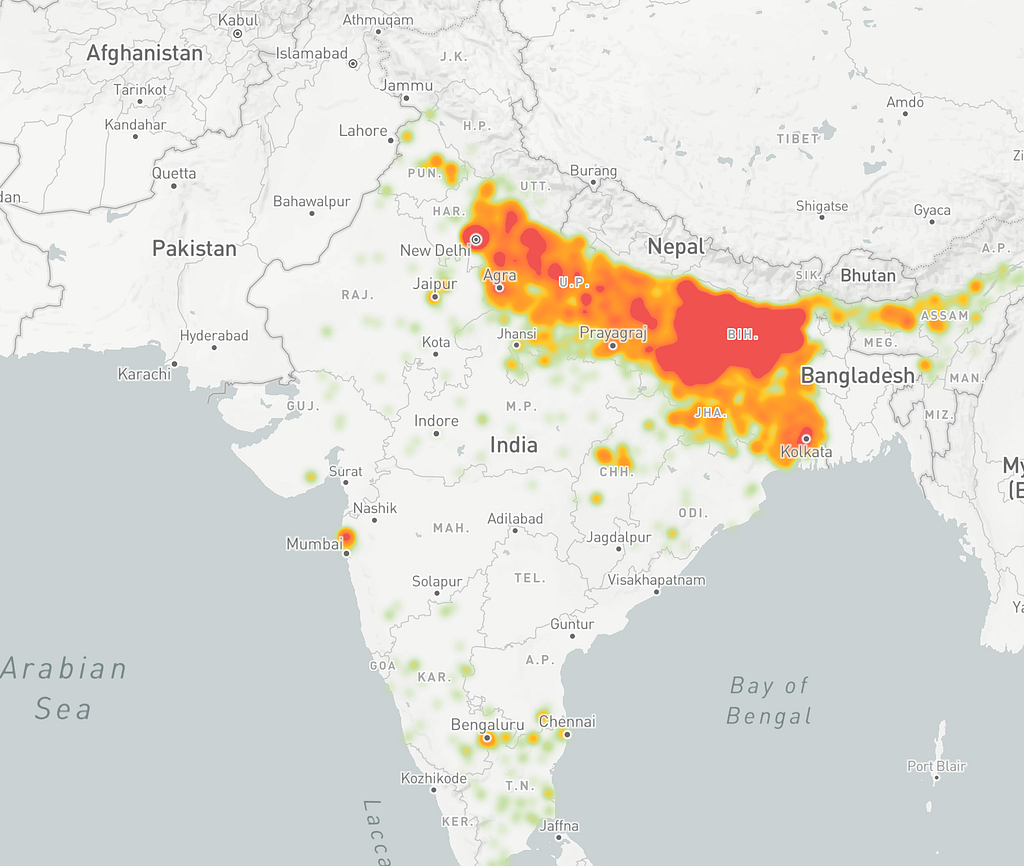
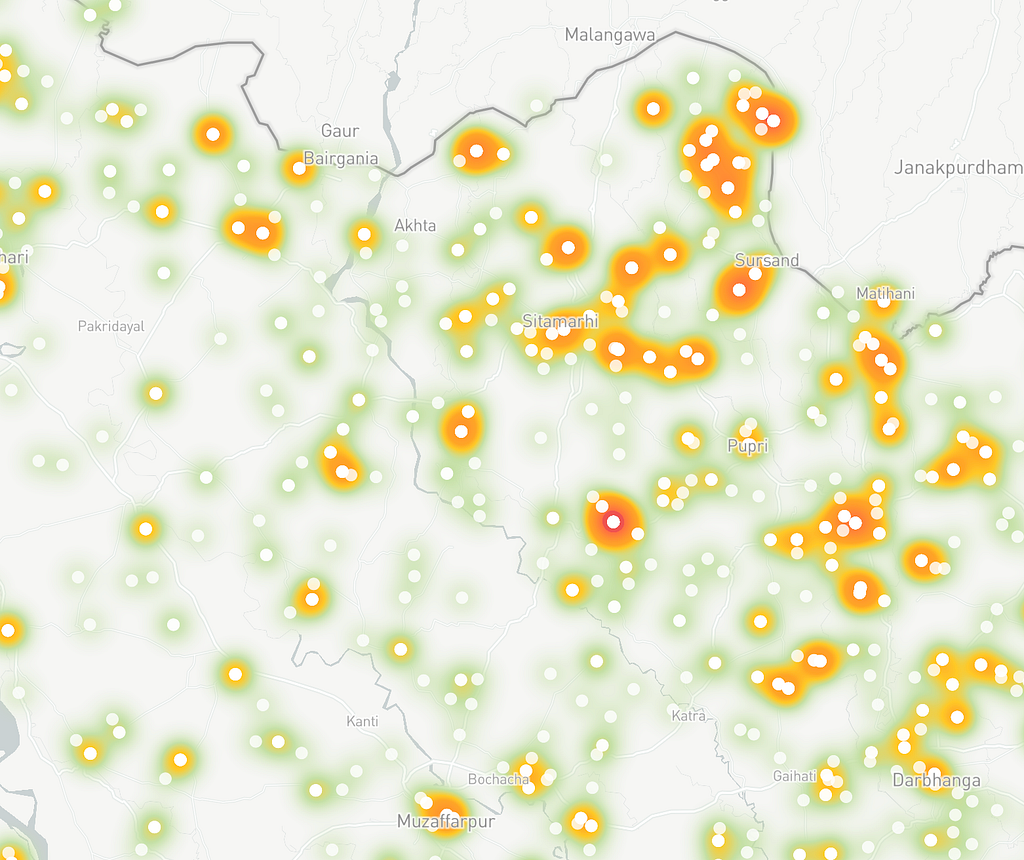
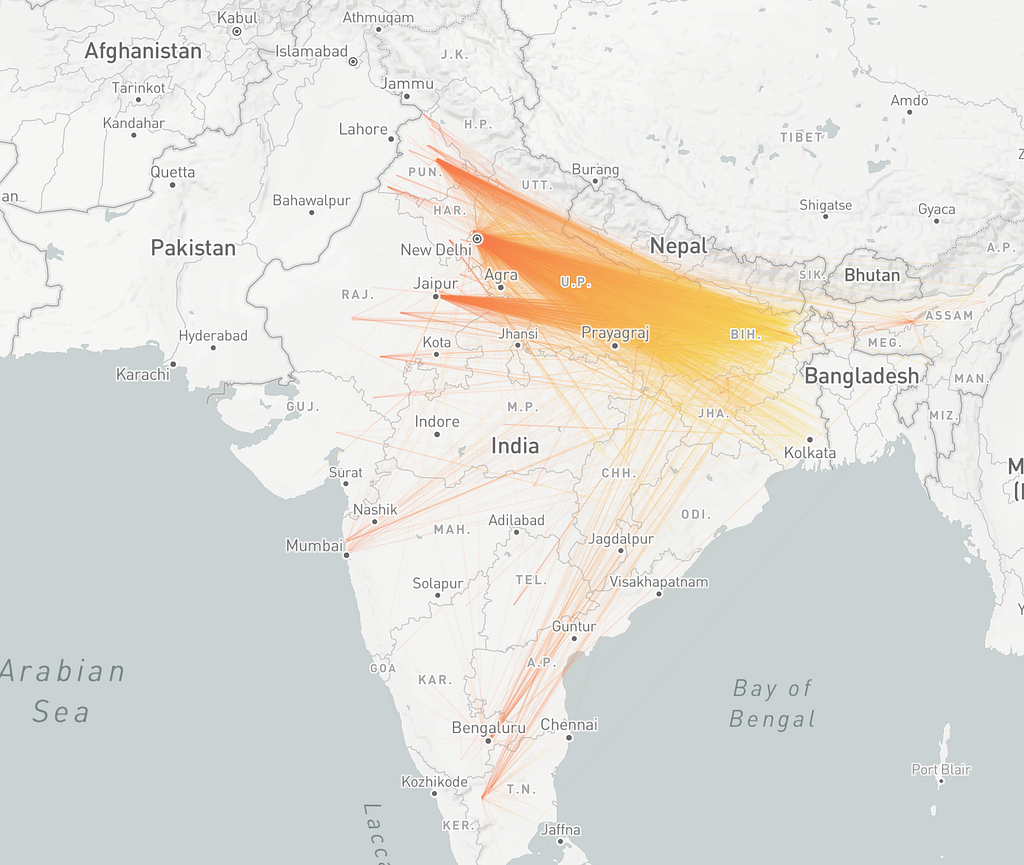
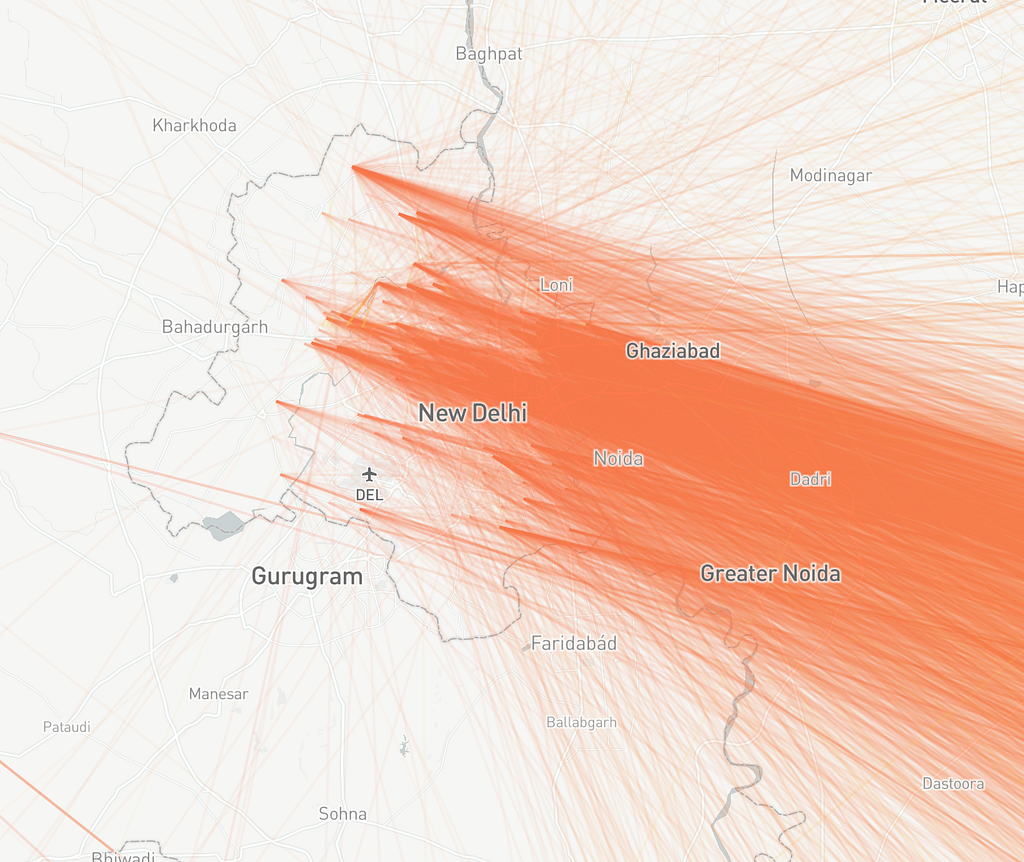
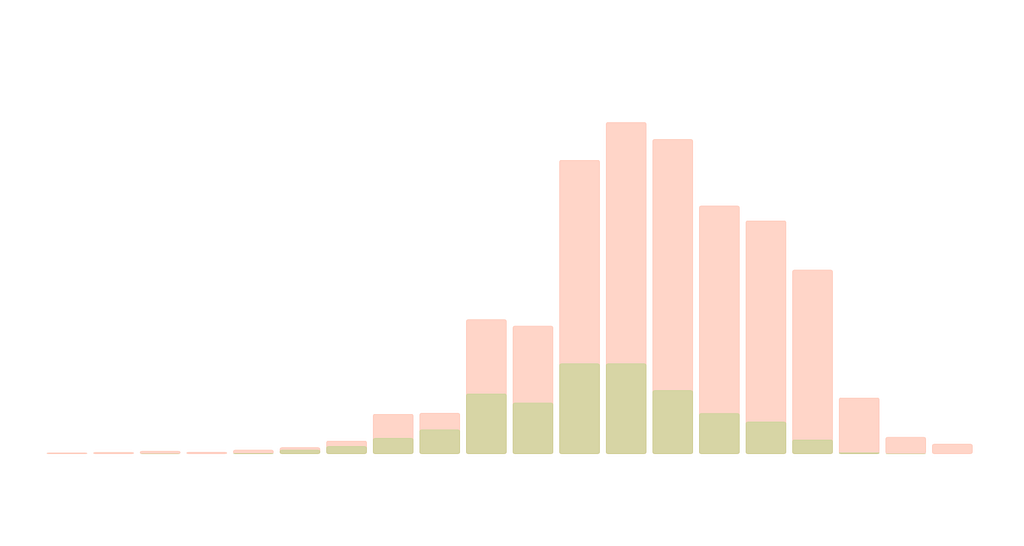
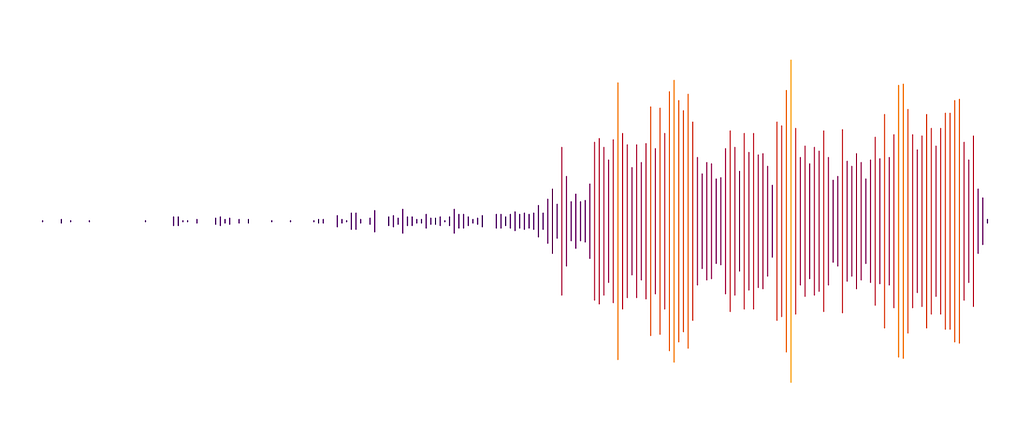
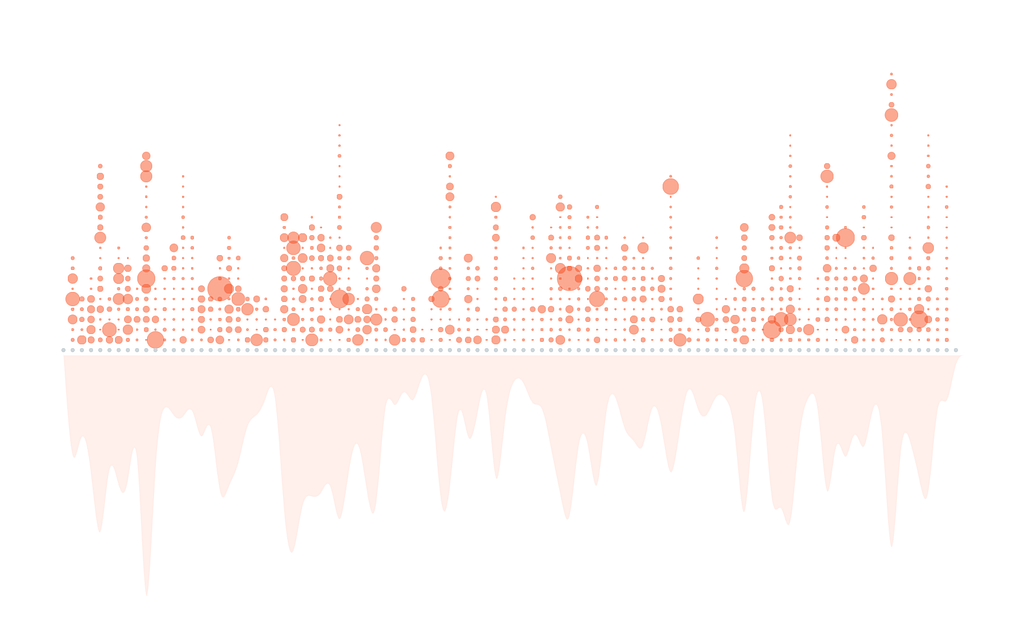
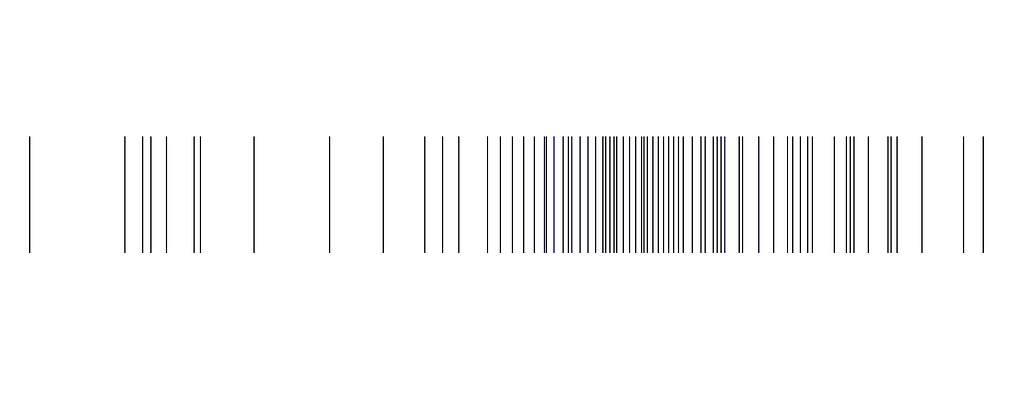
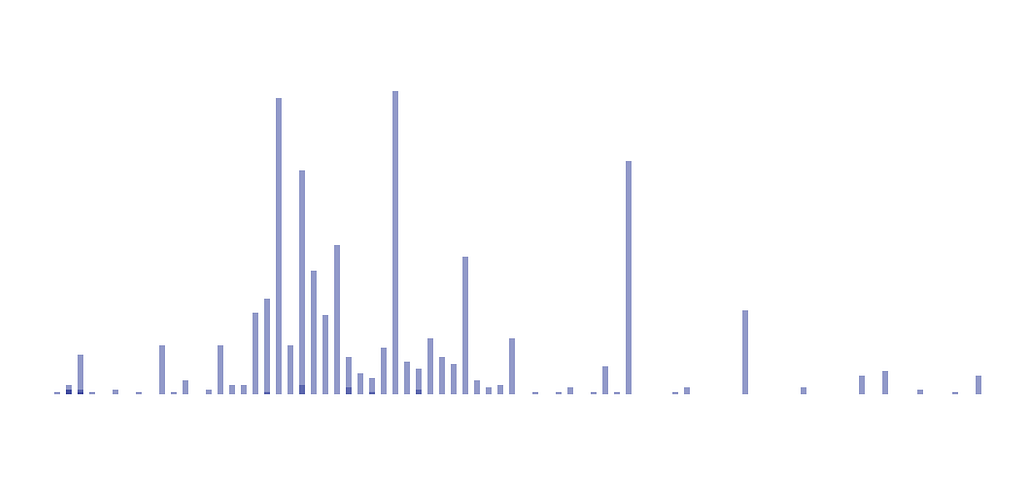
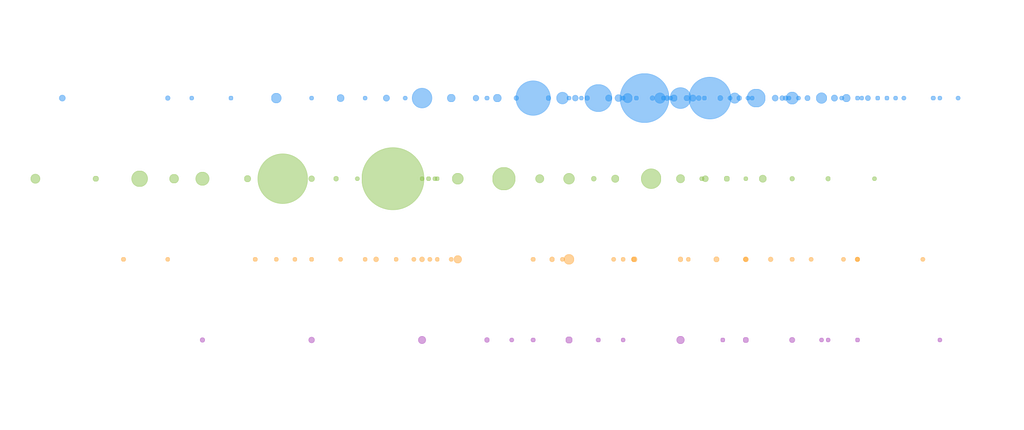
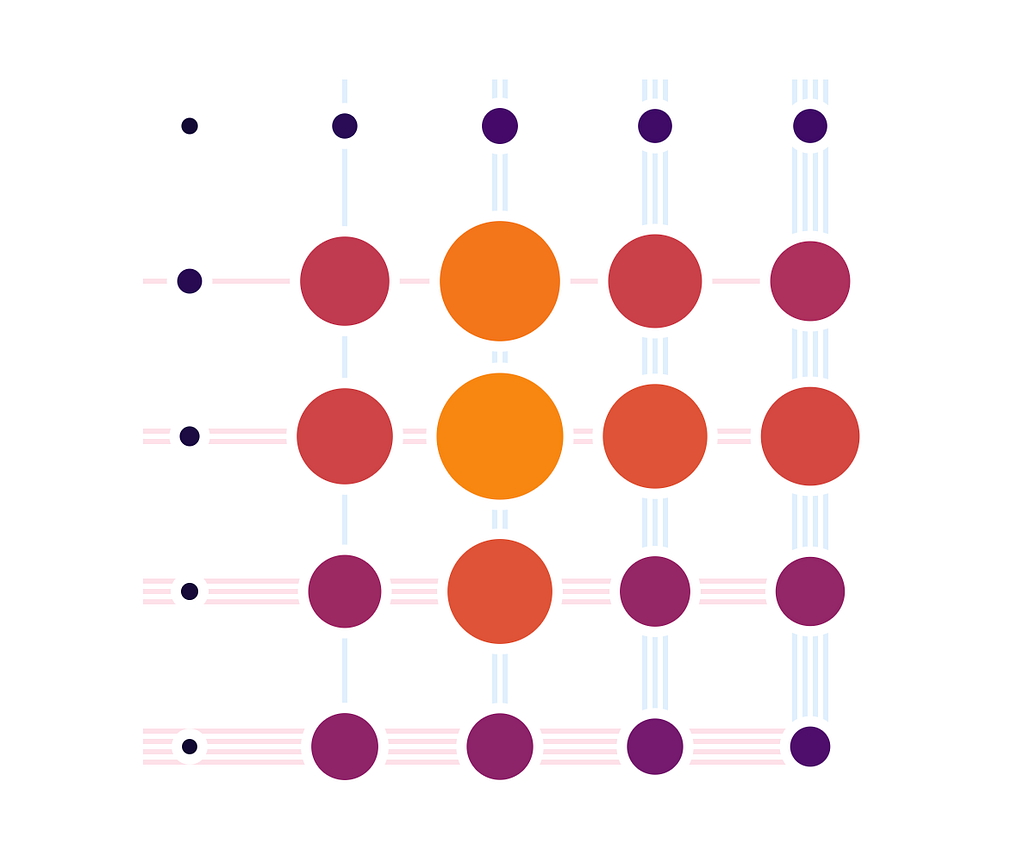
For other quantitative and qualitative data elements, I adopted a custom made style that was crafted for each factor that was being visualised.


Final Version
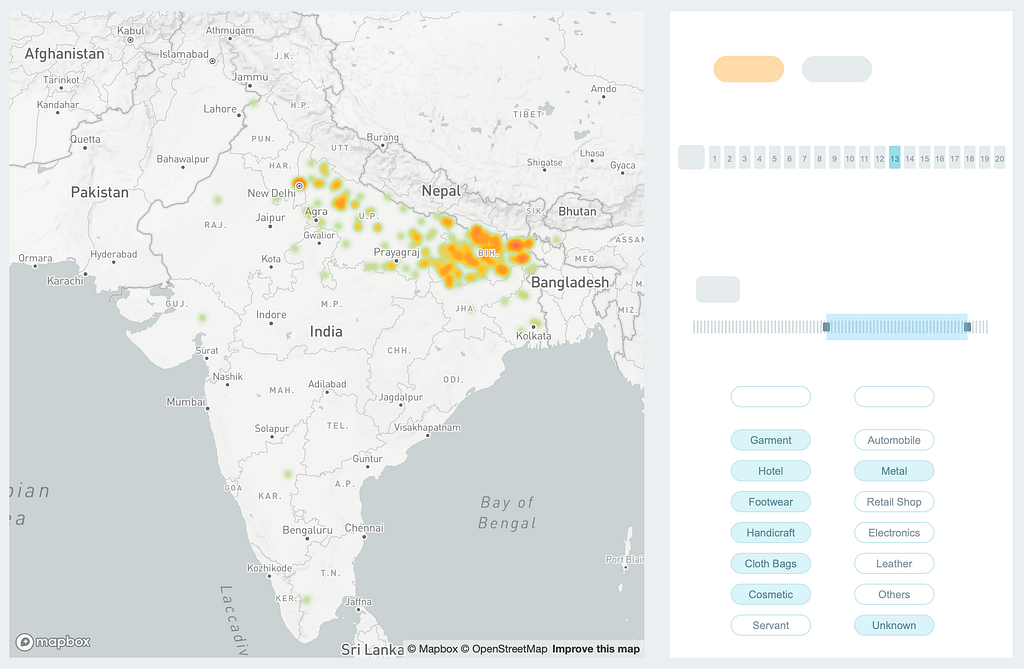
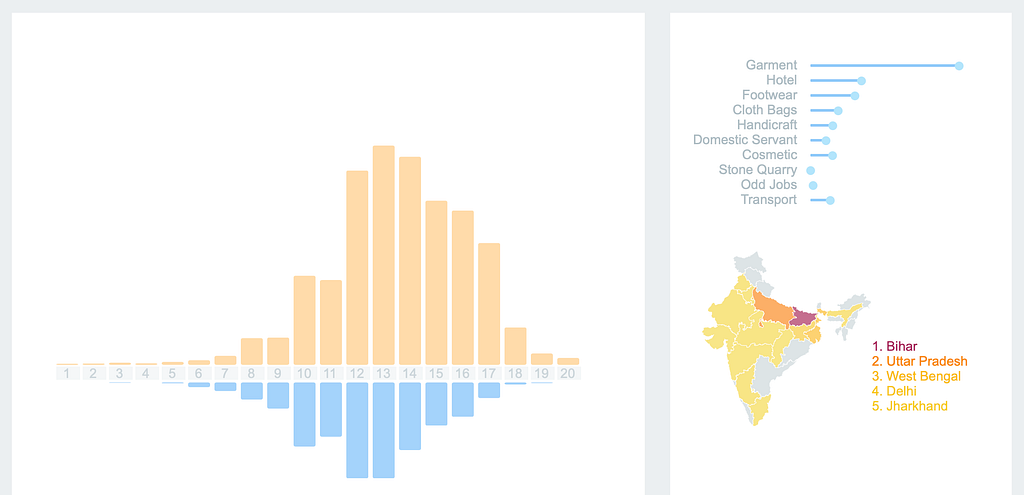
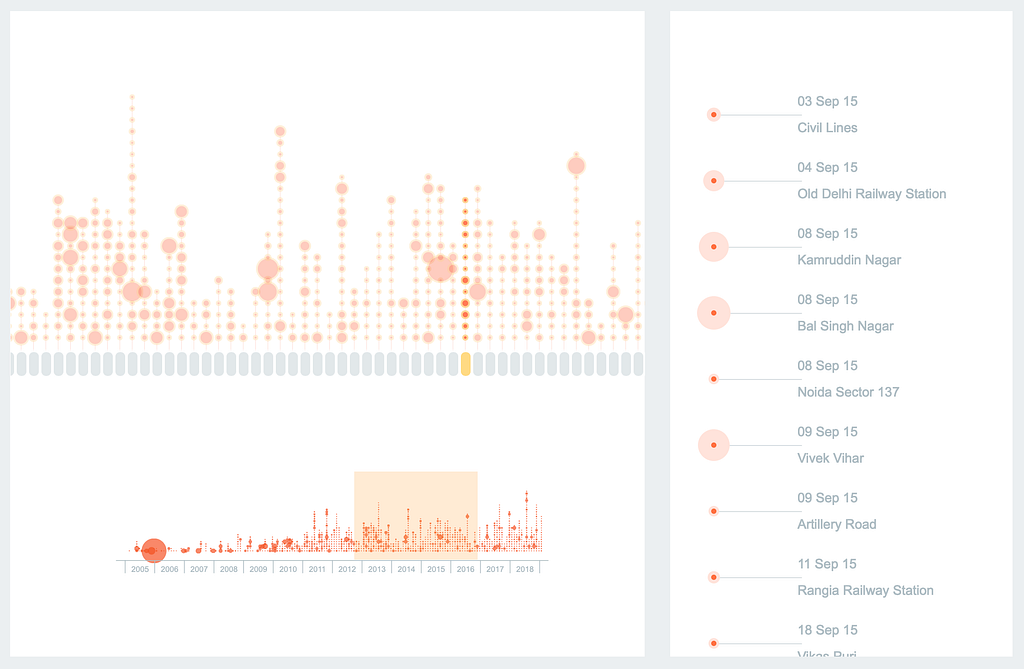
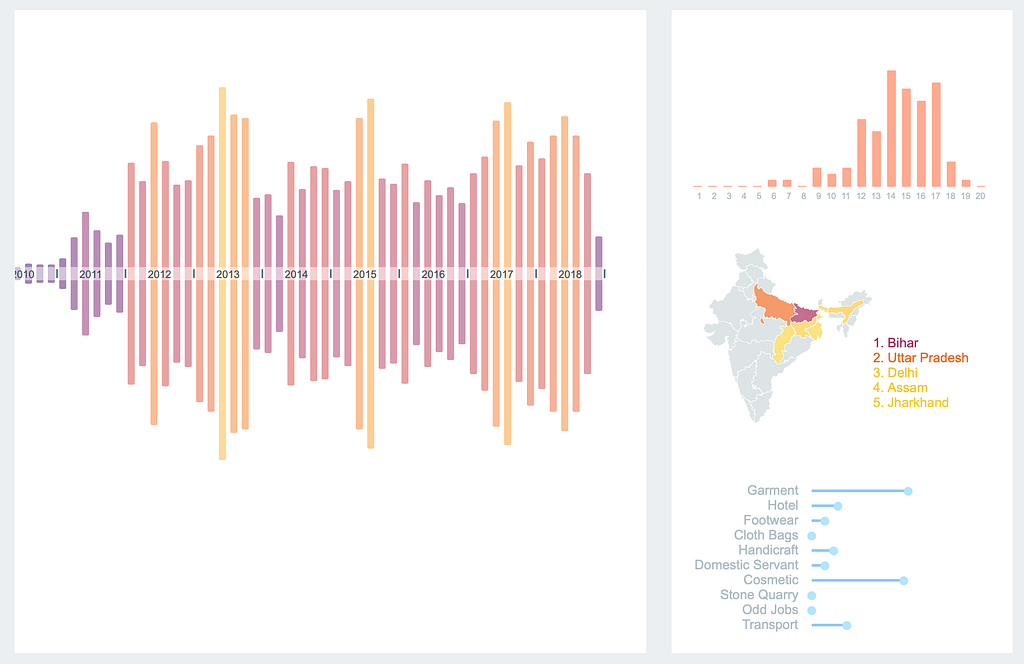
Over the course of the project, I realised that the scope of the project lies far bigger than an Interactive Data Story. After a discussion with the foundation, we decided to move ahead with the concept of a Dashboard. This dashboard would serve as a tool to understand the dynamics of child trafficking better and help policy makers to make data backed decisions.
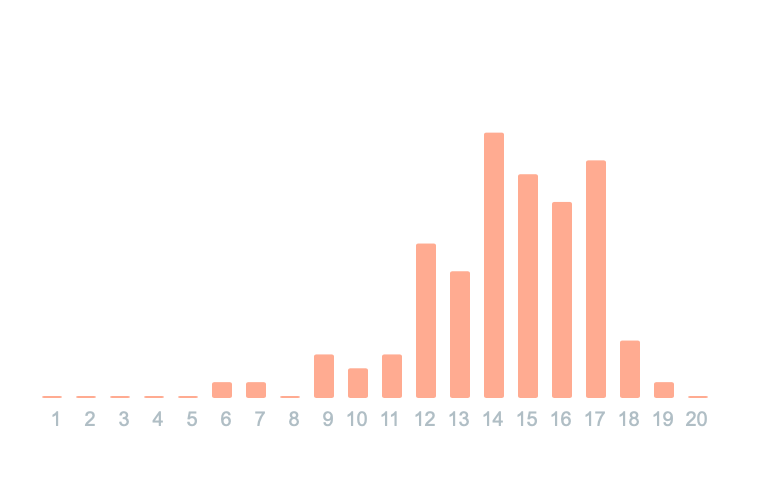
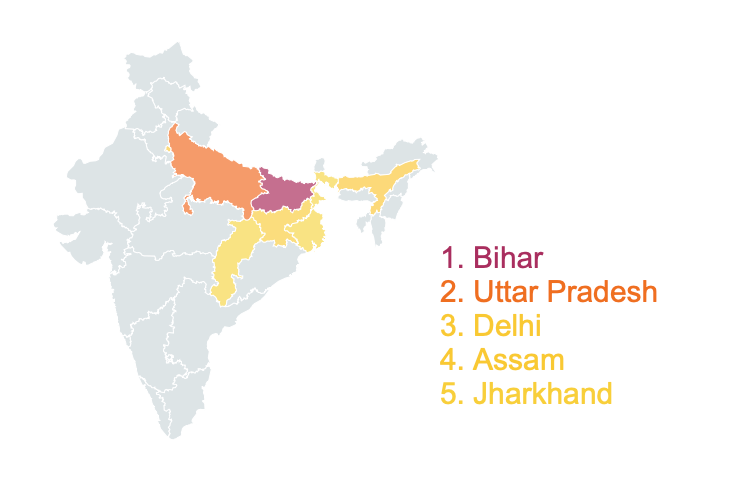
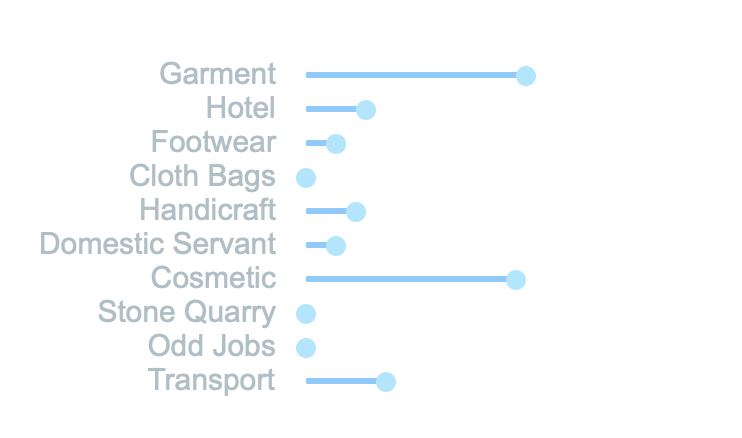
For the dashboard, I created widgets that can be plugged onto any visualisation. Clicking on a particular element would update the widgets, thus giving us a much more detailed picture of the relationship between different elements.
Roadmap
Although I’ve spent around 3 months on this, it still is an ongoing project. I plan to add some ML component that would try to predict where and when trafficking might happen. A lot more integrations within the dashboard are planned. We have already begun to get very interesting and insightful information in the current version. I plan to add more integration within the dashboard to achieve a finer granularity.